Update: See CHI's most recent analysis of the latest drug overdose data at this link.
Supporting Documents
Topics
Behavioral Health
Substance Use
Colorado County Drug Overdose Death Rate
The Colorado Health Institute (CHI) has analyzed new county-level estimates on drug overdose deaths by county from the Centers for Disease Control and Prevention in a report and a time-lapse map.
September 20, 2016
March 10, 2023

New data paint a grim picture of Colorado’s rising drug-related deaths.
The statewide rate of drug overdose deaths climbed 68 percent between 2002 and 2014, from 9.7 per 100,000 residents to 16.3 per 100,000 residents. Colorado’s 2014 rate is higher than the national average of 14.7 drug-related deaths per 100,000.
And over those 13 years, the drug overdose death rate has increased in each Colorado county except for one — Mineral County in the southwestern part of the state. In some cases, the increase has been dramatic.
The Colorado Health Institute (CHI) has analyzed new county-level estimates from the Centers for Disease Control and Prevention for this report. In addition, CHI has created a time-lapse map that tracks changes in the drug-related death rates. (Go to http://bit.ly/1StBvc0.)
Counties and Drug-Related Deaths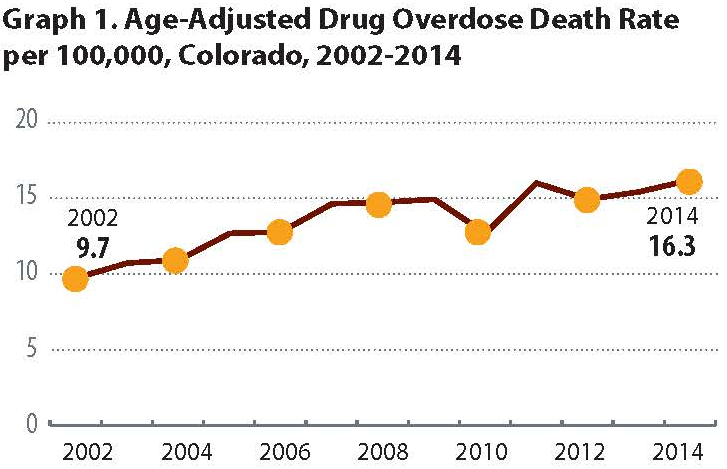
In 2014, 899 Coloradans died from either an intentional or unintentional drug overdose. But some counties are encountering more deaths than others.
Twelve Colorado counties have drug overdose death rates of more than 20 per 100,000 residents, meaning they are among the highest in the nation.
Seven of those counties — Baca, Bent, Conejos, Rio Grande, Las Animas, Costilla and Huerfano — are in rural southern Colorado. Three — Adams, Denver and Pueblo— are urban counties along the Front Range. The final two are Delta on the Western Slope and Jackson in the north.
Many of these counties have struggled with high drug death rates over those years.
The CDC adjusted the death rates for age. It also placed them in ranges per 100,000 residents. For this analysis, CHI used 11 categories from lowest to highest. For example, Category 1 covers a range of zero deaths to two deaths per 100,000 residents. Category 11 includes counties with death rates of more than 20 per 100,000 residents. (See Maps 1 and 2.)
Baca County’s drug death rate grew the fastest. In 2002, the county in far southeastern Colorado next to the Kansas border had a drug death rate of between 4.1 and 6.0 per 100,000, the third lowest category. By 2014, the death rate had grown to more than 20 deaths per 100,000, the highest category.
Indeed, 12 Colorado counties saw their death rates jump by six or more categories over the 13-year span.
In total, 21 increased by five or more categories. Huerfano County has recorded drug death rates in the highest category since 2003. In 2002, the first year of available data, it was in the second-highest category.
In sparsely populated Mineral County, home to the town of Creede, the rate has remained in the lowest category since 2002.
Methodology
Data are from the Center for Disease Control and Prevention, National Centers for Health Statistics, National Vital Statistics System, mortality data (see http:// www.cdc.gov/nchs/deaths.htm).
Deaths are classified using the International Classification of Diseases, Tenth Revision (ICD–10). Drug-poisoning deaths are defined as having ICD–10 underlying cause-of-death codes X40–X44 (unintentional), X60–X64 (suicide), X85 (homicide), or Y10–Y14 (undetermined intent).
Age-adjusted death rates (deaths per 100,000 Colorado population) are calculated in this analysis.
Because different diseases or causes of death may be more likely to occur in a certain age bracket, it is helpful to age-adjust in order to prevent data from being biased simply because a population skews older or younger.
NOTE: This map is based on data from the CDC, which used information from the National Vital Statistics System to estimate stable rates of deaths due to drug poisoning for each county. CHI’s 2018 overdose maps are based on data from the CDPHE, which uses numbers of deaths reported to determine actual, rather than estimated, rates.