A hiker with poles and a backpack on a mountain vista looks out at the valley below.
Topics

Colorado’s Climate and Colorado’s Health

Examining the Connection
August 1, 2023

Colorado’s changing climate poses health risks – now and into the future.

Studies show that climate change and health are linked. Rising temperatures, polluted air and extreme weather, among the most impactful results of climate change, threaten both physical and psychological well-being.10 Children, seniors and people with lung or heart disease are especially at risk.

Coloradans are witnessing climate changes in various forms.

Snowpack is melting sooner and more quickly.11 Erratic weather — snow one day, spring conditions the next — is becoming more common. Wildfires are burning more acreage and igniting with greater frequency. The state’s average temperature has risen by two degrees Fahrenheit in the past 30 years,12 an increase that ranks Colorado as the 20th fastest-warming state since 1970.13

Two degrees may seem like a small increase but this temperature change has happened unusually fast. Historically, such temperature changes took place over thousands of years.14

A great deal of work is being done at the intersection of climate change and health. The American Public Health Association has designated 2017 the year of climate change and health, calling climate change the nation’s greatest public health challenge.15 The United Nations Environment Program says that climate change is one of the biggest threats to worldwide environmental and human health.16

At the state level, Colorado’s voters passed a law in 2004 creating first-in-the-nation renewable energy standards for electricity producers, which has placed Colorado among the leaders in renewable energy.

The state's 2007 Climate Plan, created by former Gov. Bill Ritter and updated in 2015 by Gov. John Hickenlooper, calls for regulating greenhouse gas emissions (GHG), conserving water and encouraging community-level action. Colorado is one of 33 states and the District of Columbia with a climate change plan.

Four Colorado cities — Aspen, Boulder, Denver and Fort Collins — have adopted local climate action plans.

This brief delves into the health impacts of three climate-change factors relevant to Colorado: rising temperatures, worsening air quality and extreme weather. It identifies Coloradans who will be most impacted by climate change and looks at the policy actions underway and the policy questions on the horizon.

Making the Connection: Climate Change and Health in Colorado

Colorado, as a landlocked state with complex landscapes ranging from mountains to plains, experiences climate-related events differently than other states. Extreme weather events such as blizzards and droughts are more common in Colorado, while hurricanes and flooding impact coastal states such Louisiana and Florida.

The consequences of climate change tend to be interconnected. Rising temperatures are likely to impact Colorado’s most valuable natural resource — water. Snow accounts for 70 percent of the state’s surface water supply.17, 18 As snow melt drains from the mountains earlier in the spring due to higher temperatures, less water is available later in the year to feed forests and meet agricultural and human needs.

Meanwhile, as Colorado’s climate warms, forests dry out. Thirsty forests, in turn, are ripe for wildfires.

Smoke and dust from fires pollute the air. And dirty air is a health hazard, particularly for people with breathing difficulties.

The following sections delve into the three climate change results that are expected to most affect the health of Coloradans, according to a synthesis of the research.

Rising Temperatures

Heat is one of the biggest climate-related public health threats, according to the Centers for Disease Control and Prevention (CDC).19

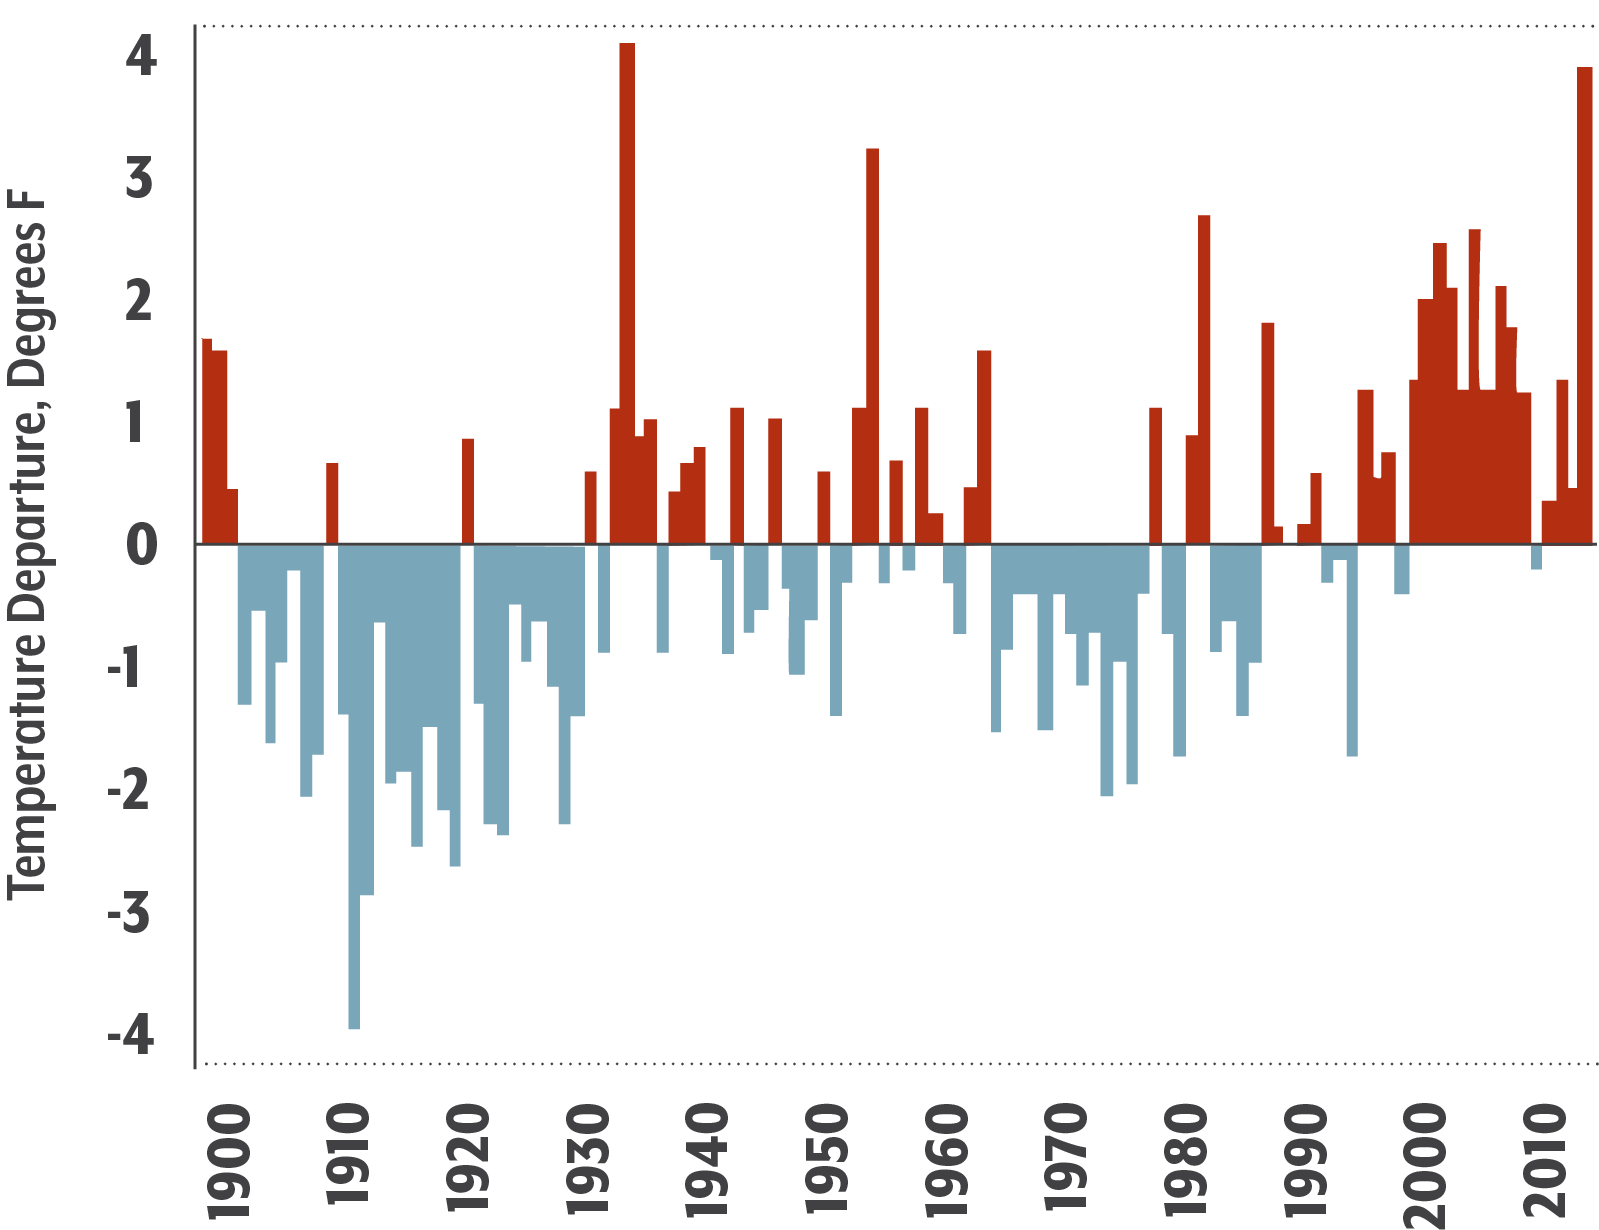
Colorado’s average temperature has varied over the past century. Scientists have established a baseline temperature based on a 30-year average. (See Figure 1.) They plotted the annual average temperature relative to that average from 1900 to 2012. The blue bars represent years when the average temperature was below the 30-year baseline. Red bars mark years when the average temperature rose above the baseline.

Colorado’s temperature spiked during the Dust Bowl in the 1930s and again in the 1950s. Temperatures began to be consistently higher than the average beginning in the mid-1990s.

Colorado’s average temperature has increased by two degrees Fahrenheit in the past 30 years. Looking ahead, climate models indicate a warmer future for Colorado. Projections say the state’s average temperature could be five degrees higher by 2050.20, 21 Such increases significantly outpace historical trends.

Currently, average summer temperatures in the Denver metro area are in the low- to mid-80s, but Denver has recorded several summers with 12 or more consecutive days above 90 degrees since 2008.22 Unusually hot temperatures — days above 90 degrees — can potentially harm health.23

It’s possible that 90-plus degrees could become Colorado's average summer temperature by mid-century, according to the Western Water Assessment Team at CU-Boulder.24

To put that in perspective, the National Oceanic and Atmospheric Administration (NOAA), a scientific agency within the U.S. Department of Commerce that studies climate, says that as time goes on Denver will begin to feel more like Pueblo in the summer, where average highs are in the low 90s.25, 26

Health Implications

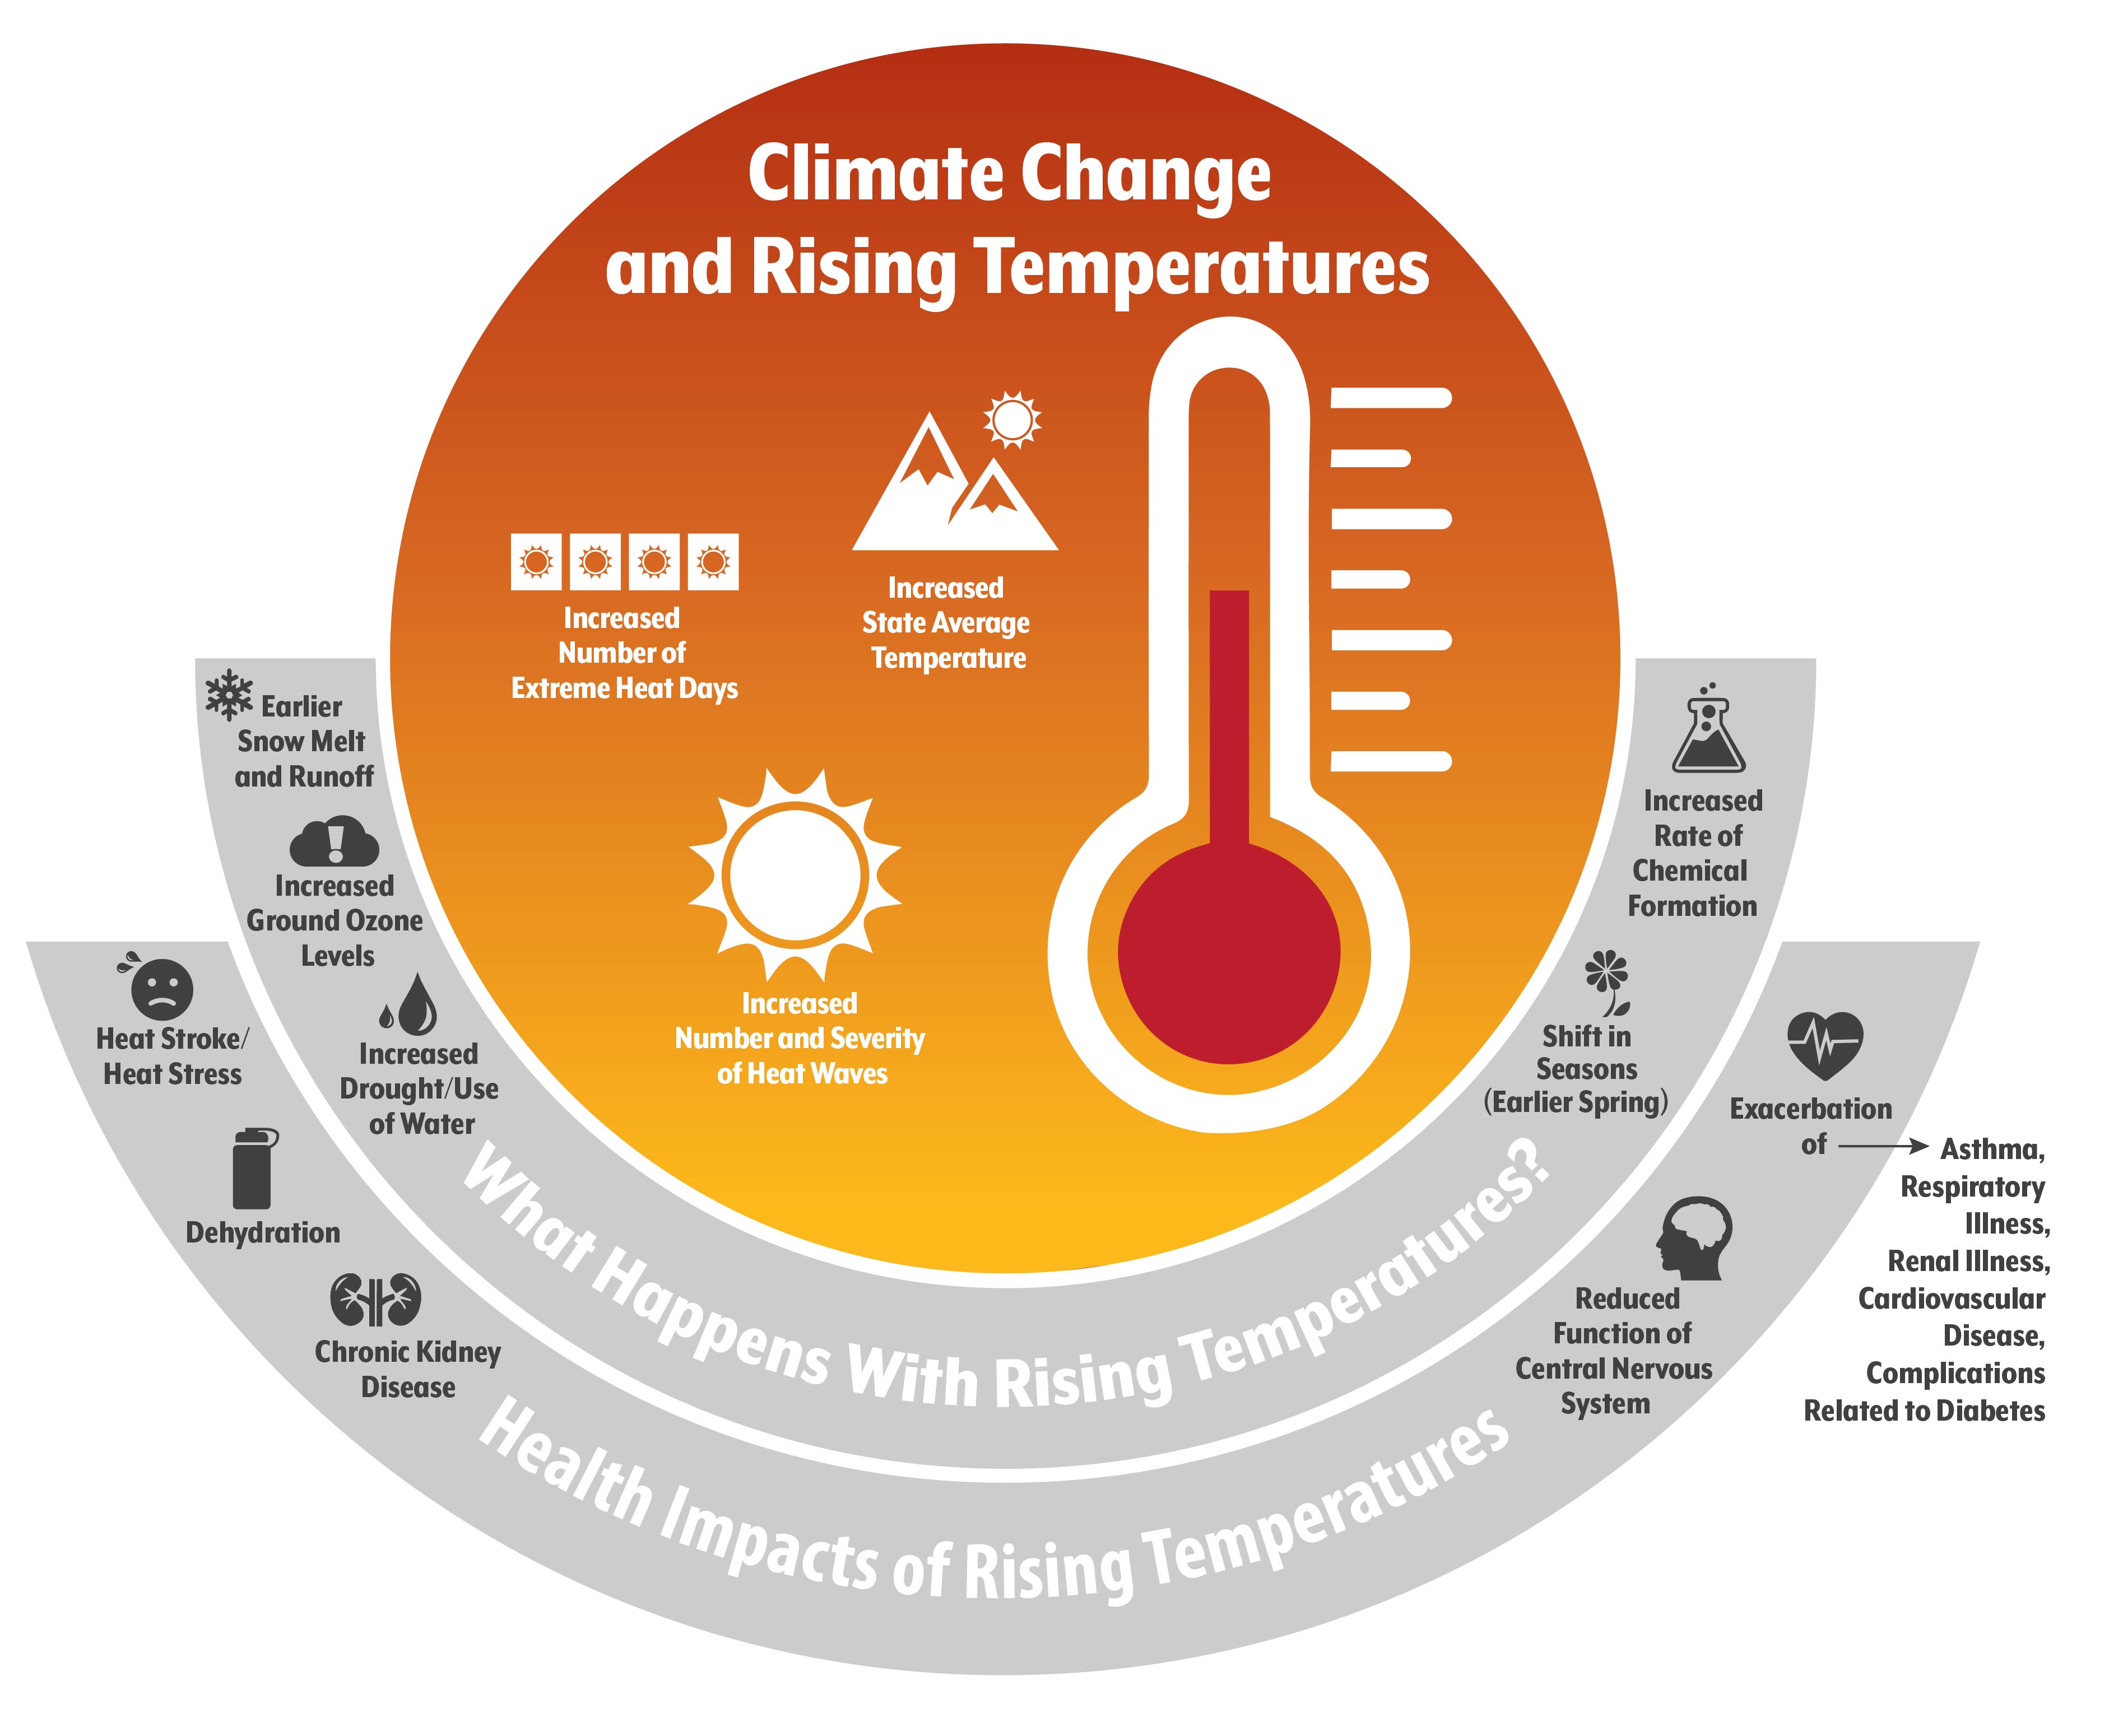
  • Extreme heat affects cardiovascular, respiratory and nervous systems.27 (See Figure 2.)
  • Warmer temperatures also can cause heat stroke and dehydration.28

Vulnerable Coloradans

  • Almost six percent of Colorado’s adults have cardiovascular disease, putting them at an increased risk for heat exhaustion and heat stroke. A weakened heart has a harder time pumping blood throughout the body to normalize temperatures.
  • The seven percent of Colorado’s adults with diabetes can have trouble cooling their bodies on hot days, a result of damage to blood vessels and nerves that impact sweat glands. Higher temperatures can also change how a person with diabetes uses insulin, requiring more frequent blood sugar tests and careful dietary choices.29
  • The state’s 1.2 million children are especially vulnerable. Children absorb more heat than adults because they have a greater ratio of skin surface to weight.30
  • The 711,000 seniors over age 65 are at increased risk because chronic illness and age can hinder the ability to regulate body temperature.

Figure 1. Colorado Temperature Trends, 1900-2012

Image

Figure 2: Climate Change and Rising Temperatures

Image

Air Quality

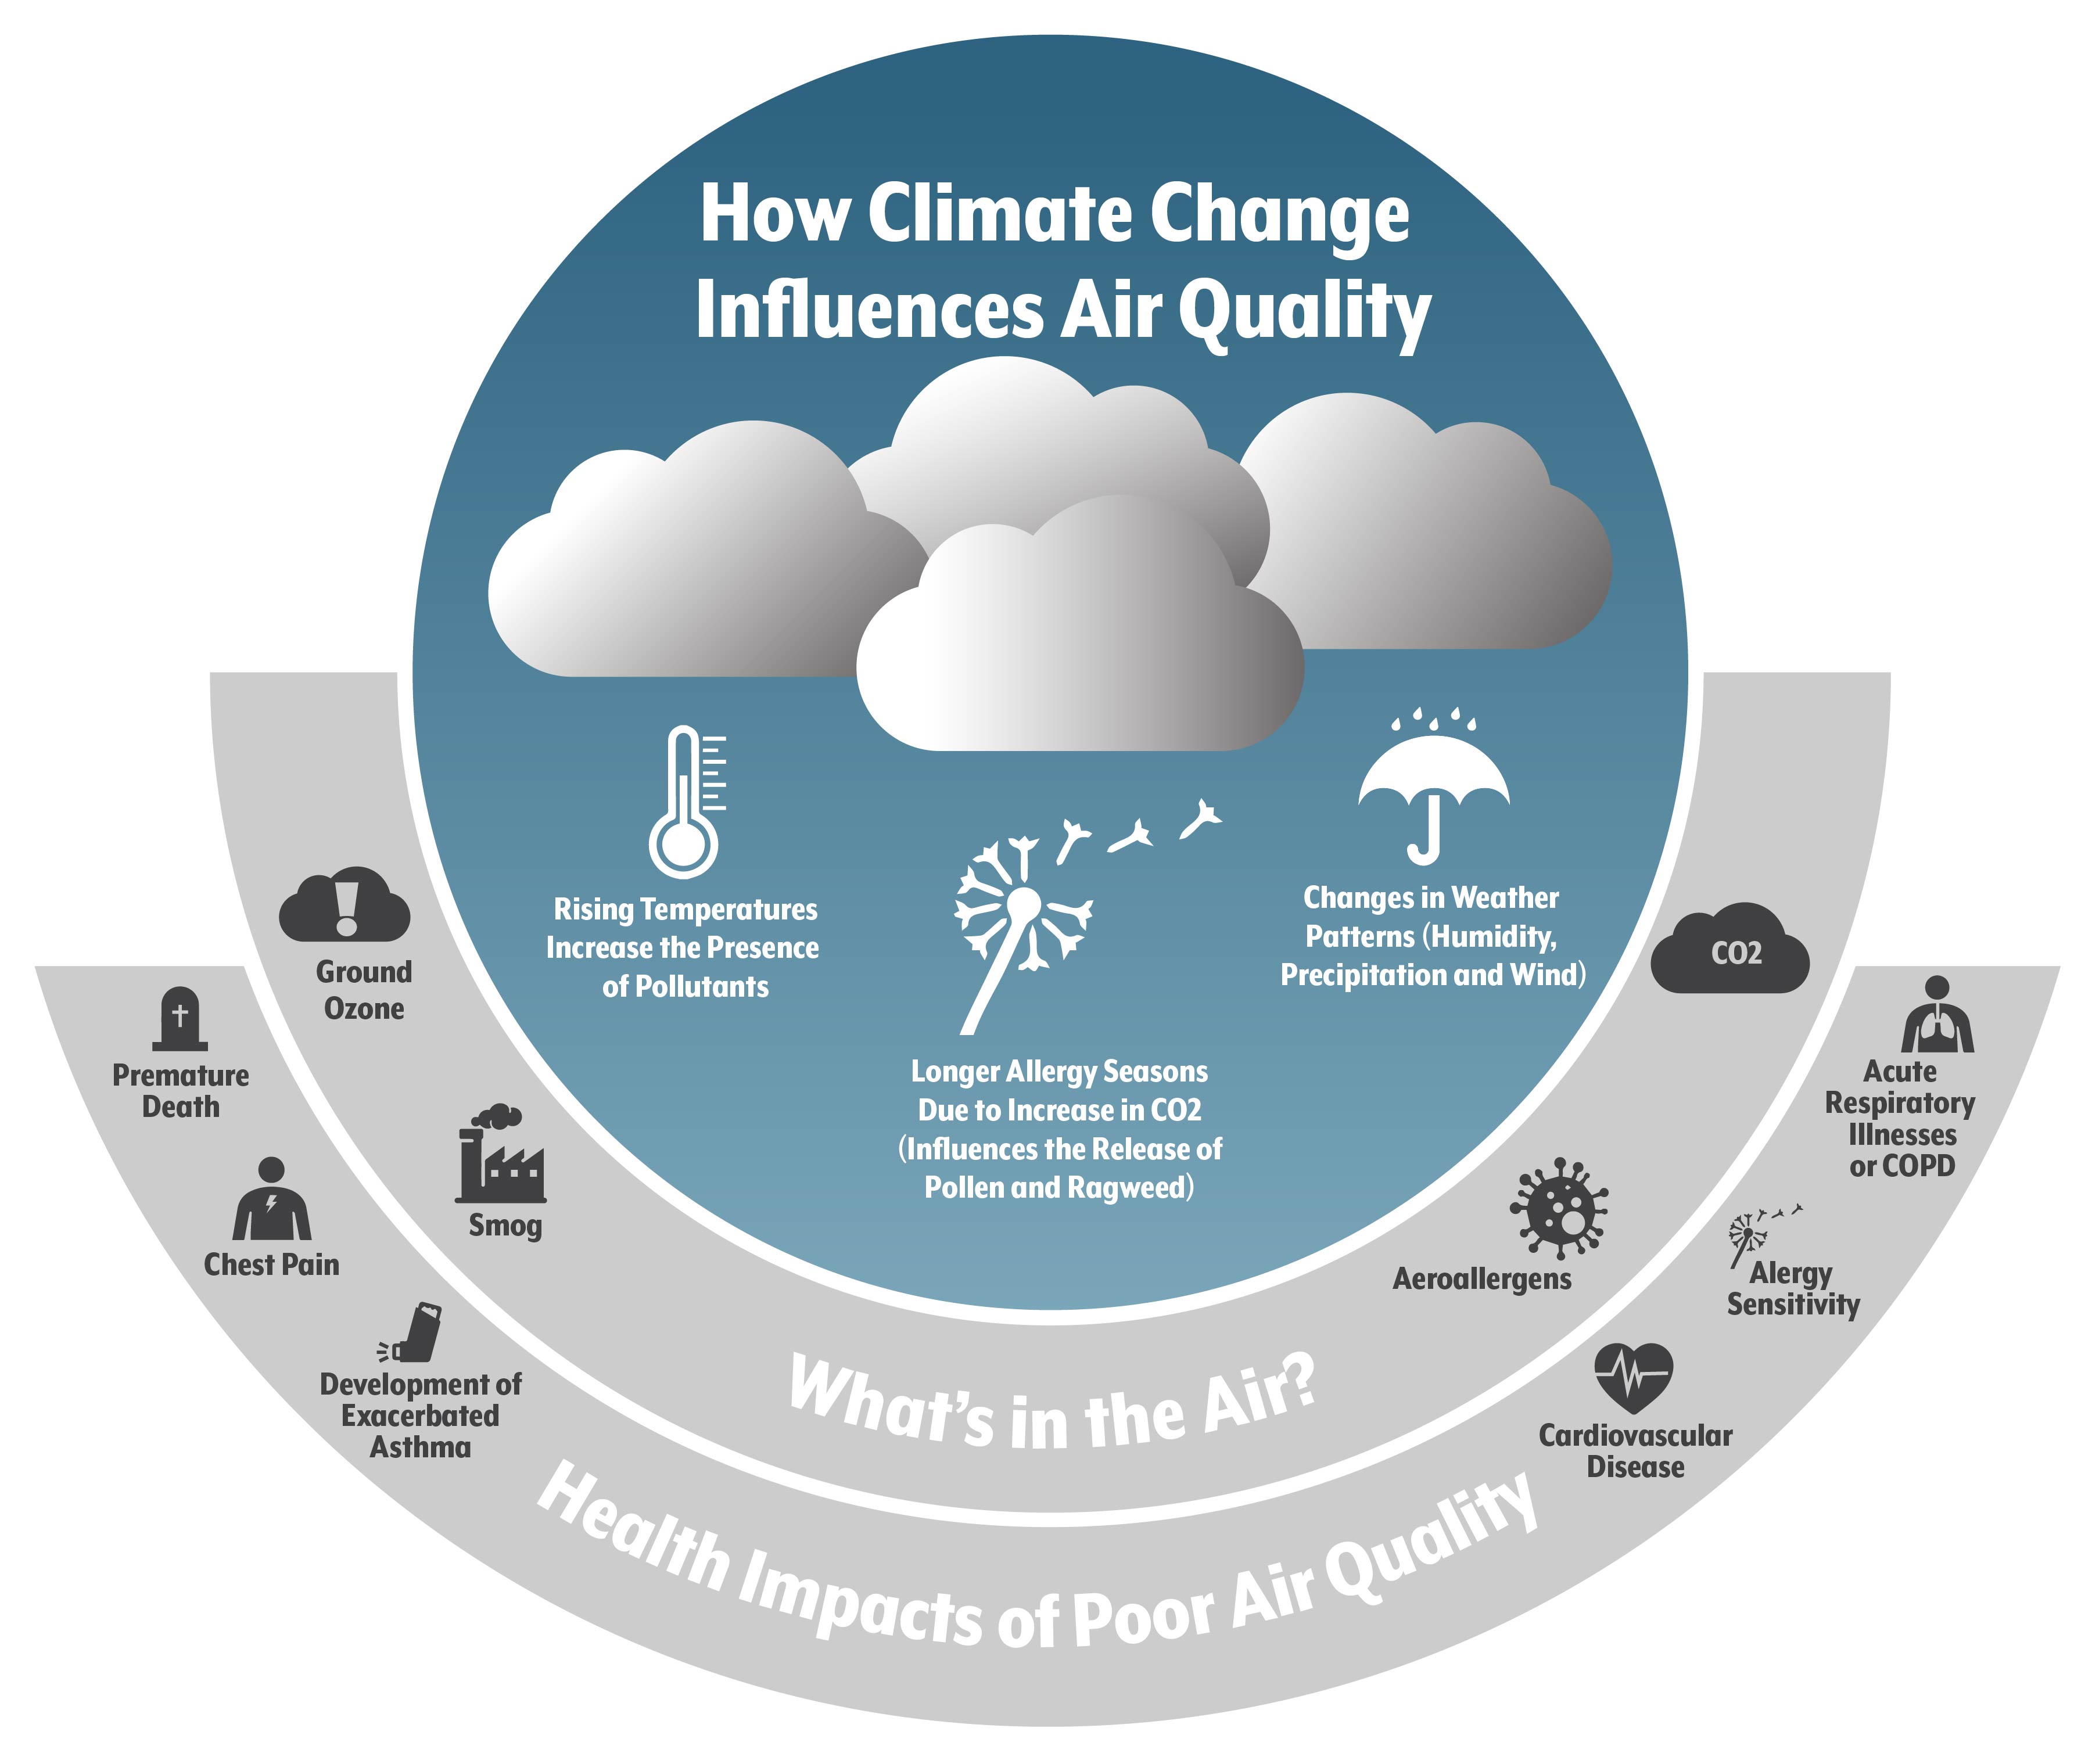
Changes in weather patterns — even slight modifications of wind, temperature, humidity or cloud level — increase pollutants such as ozone, carbon dioxide and particulate matter, which in turn impact overall air quality. (See Figure 3.)

Ozone can be good or bad for health depending on its location in the atmosphere. The Environmental Protection Agency (EPA) characterizes ozone as “good up high, but bad nearby.” The “good up high” ozone is six to 30 miles above the ground. This layer of ozone protects the Earth from harmful ultraviolet rays. 31

The “bad nearby” ozone is at ground level. It is created when chemicals and pollutants in the air are “cooked” in the heat and sunlight. Ground ozone is at its highest levels in the summer when temperatures reach into the upper 80s and mid-90s. 32

In 2016, Metro Denver was ranked the eighth most ozone-polluted urban area in America by the American Lung Association. Fort Collins was 10th. Both cities saw a slight improvement in the 2017 rankings. Denver moved from eighth to 11th and Fort Collins from 10th to 15th. 33, 34

High ozone days can be attributed to several factors, including motor vehicles, factories, gas stations and paint and chemical plants, according to the American Lung Association. 35, 36, 37

Adams, Arapahoe, Boulder, Broomfield, Denver, Douglas and Jefferson counties, along with parts of Larimer and Weld counties — an area designated as Denver Metro and Northern Front Range (DM/NFR) — have violated EPA ozone standards since they were set in the 1970s under the Clean Air Act. 38

The DM/NFR area has until July 2018 to meet the 2008 standards of 75 parts per billion (ppb), a goal which will be difficult to achieve. 39, 40

The DM/NFR region will be further challenged in meeting even stricter national standards adopted in 2015. These changes called for a reduction in ozone emissions from the 2008 standard of 75 ppb to 70 ppb. The EPA will reevaluate the region in late 2023 for compliance with these new 2015 standards. 41, 42, 43

Health Implications

  • Ozone is a lung irritant, meaning that high levels can cause breathing problems.
  • Pollutants such as particulate matter and carbon dioxide (CO2) can cause or exacerbate allergies.
  • Warmer temperatures and an increased presence of CO2 promote growth of plants that release airborne allergens. 44 This seasonal shift could extend the allergy season.

Vulnerable Coloradans

  • Seniors with bronchitis or emphysema.
  • The 107,000 children with asthma. 45
  • The approximately 380,000 adults with asthma.
  • The 180,000 Colorado adults with respiratory ailments such as Chronic Obstructive Pulmonary Disease (COPD).
  • Coloradans who are prone to pollen and mold allergies.46

Figure 3. Air Quality

Image

Glossary of Climate Terms

Expand to Read More

Climate reflects the average weather conditions over a relatively long period, usually at least 30 years.1

Climate Change Adaptation refers to actions to lessen the impact on health and the environment (of climate change) that can’t be prevented through mitigation. Examples include health advisories for anticipated disease outbreaks or heat waves.

Climate Change Mitigation refers to actions to reduce greenhouse gas emissions and to enhance the environment’s ability to take carbon dioxide out of the atmosphere.2 Mitigation strategies include constructing energy efficient buildings, public transit systems and increasing the use of renewable energy.

Extreme Heat is summertime weather that is substantially hotter and/or more humid than average for that location at that time of the year, according to the Environmental Protection Agency.3

Nitrates are inorganic nitrogen compounds found at elevated levels in water and soil after wildfires.4 Nitrates can remain in water sources, such as streams or rivers, for several years after a fire. Human exposure to excess amounts of these compounds can inhibit the ability of blood to move oxygen throughout the body. Infants under six months are most sensitive to nitrate exposure.5

Ozone is an air pollutant created by chemical reactions that happen in the presence of sunlight. It can be good or bad for health, depending on its location in the atmosphere. Ground ozone is part of the air we breathe. It affects lung function, causes airway inflammation, coughing, throat irritation and other respiratory problems. Ozone high in the atmosphere — six to 30 miles above the ground — protects the Earth from harmful ultraviolet rays.

Particulate Matter (PM) is a mix of small particles and liquid droplets in the air that is released by factories, automobiles and more. High levels of PM can be detrimental to the health of people with serious respiratory problems. The smaller the particles the more harmful to human health because they can travel deeper into the lungs.6, 7

Turbidity is the relative clearness of a liquid. After an intense wildfire, drinking water can become very cloudy, or turbid, and contain pathogens — a bacterium or virus — that can cause disease. Proper treatment can effectively remove harmful pathogens and other microbes.8

Weather is measured over shorter periods of time than climate, for example from day to day.9

Wildfires

Climate and weather strongly influence the health of forests and the intensity and size of wildfires.47    

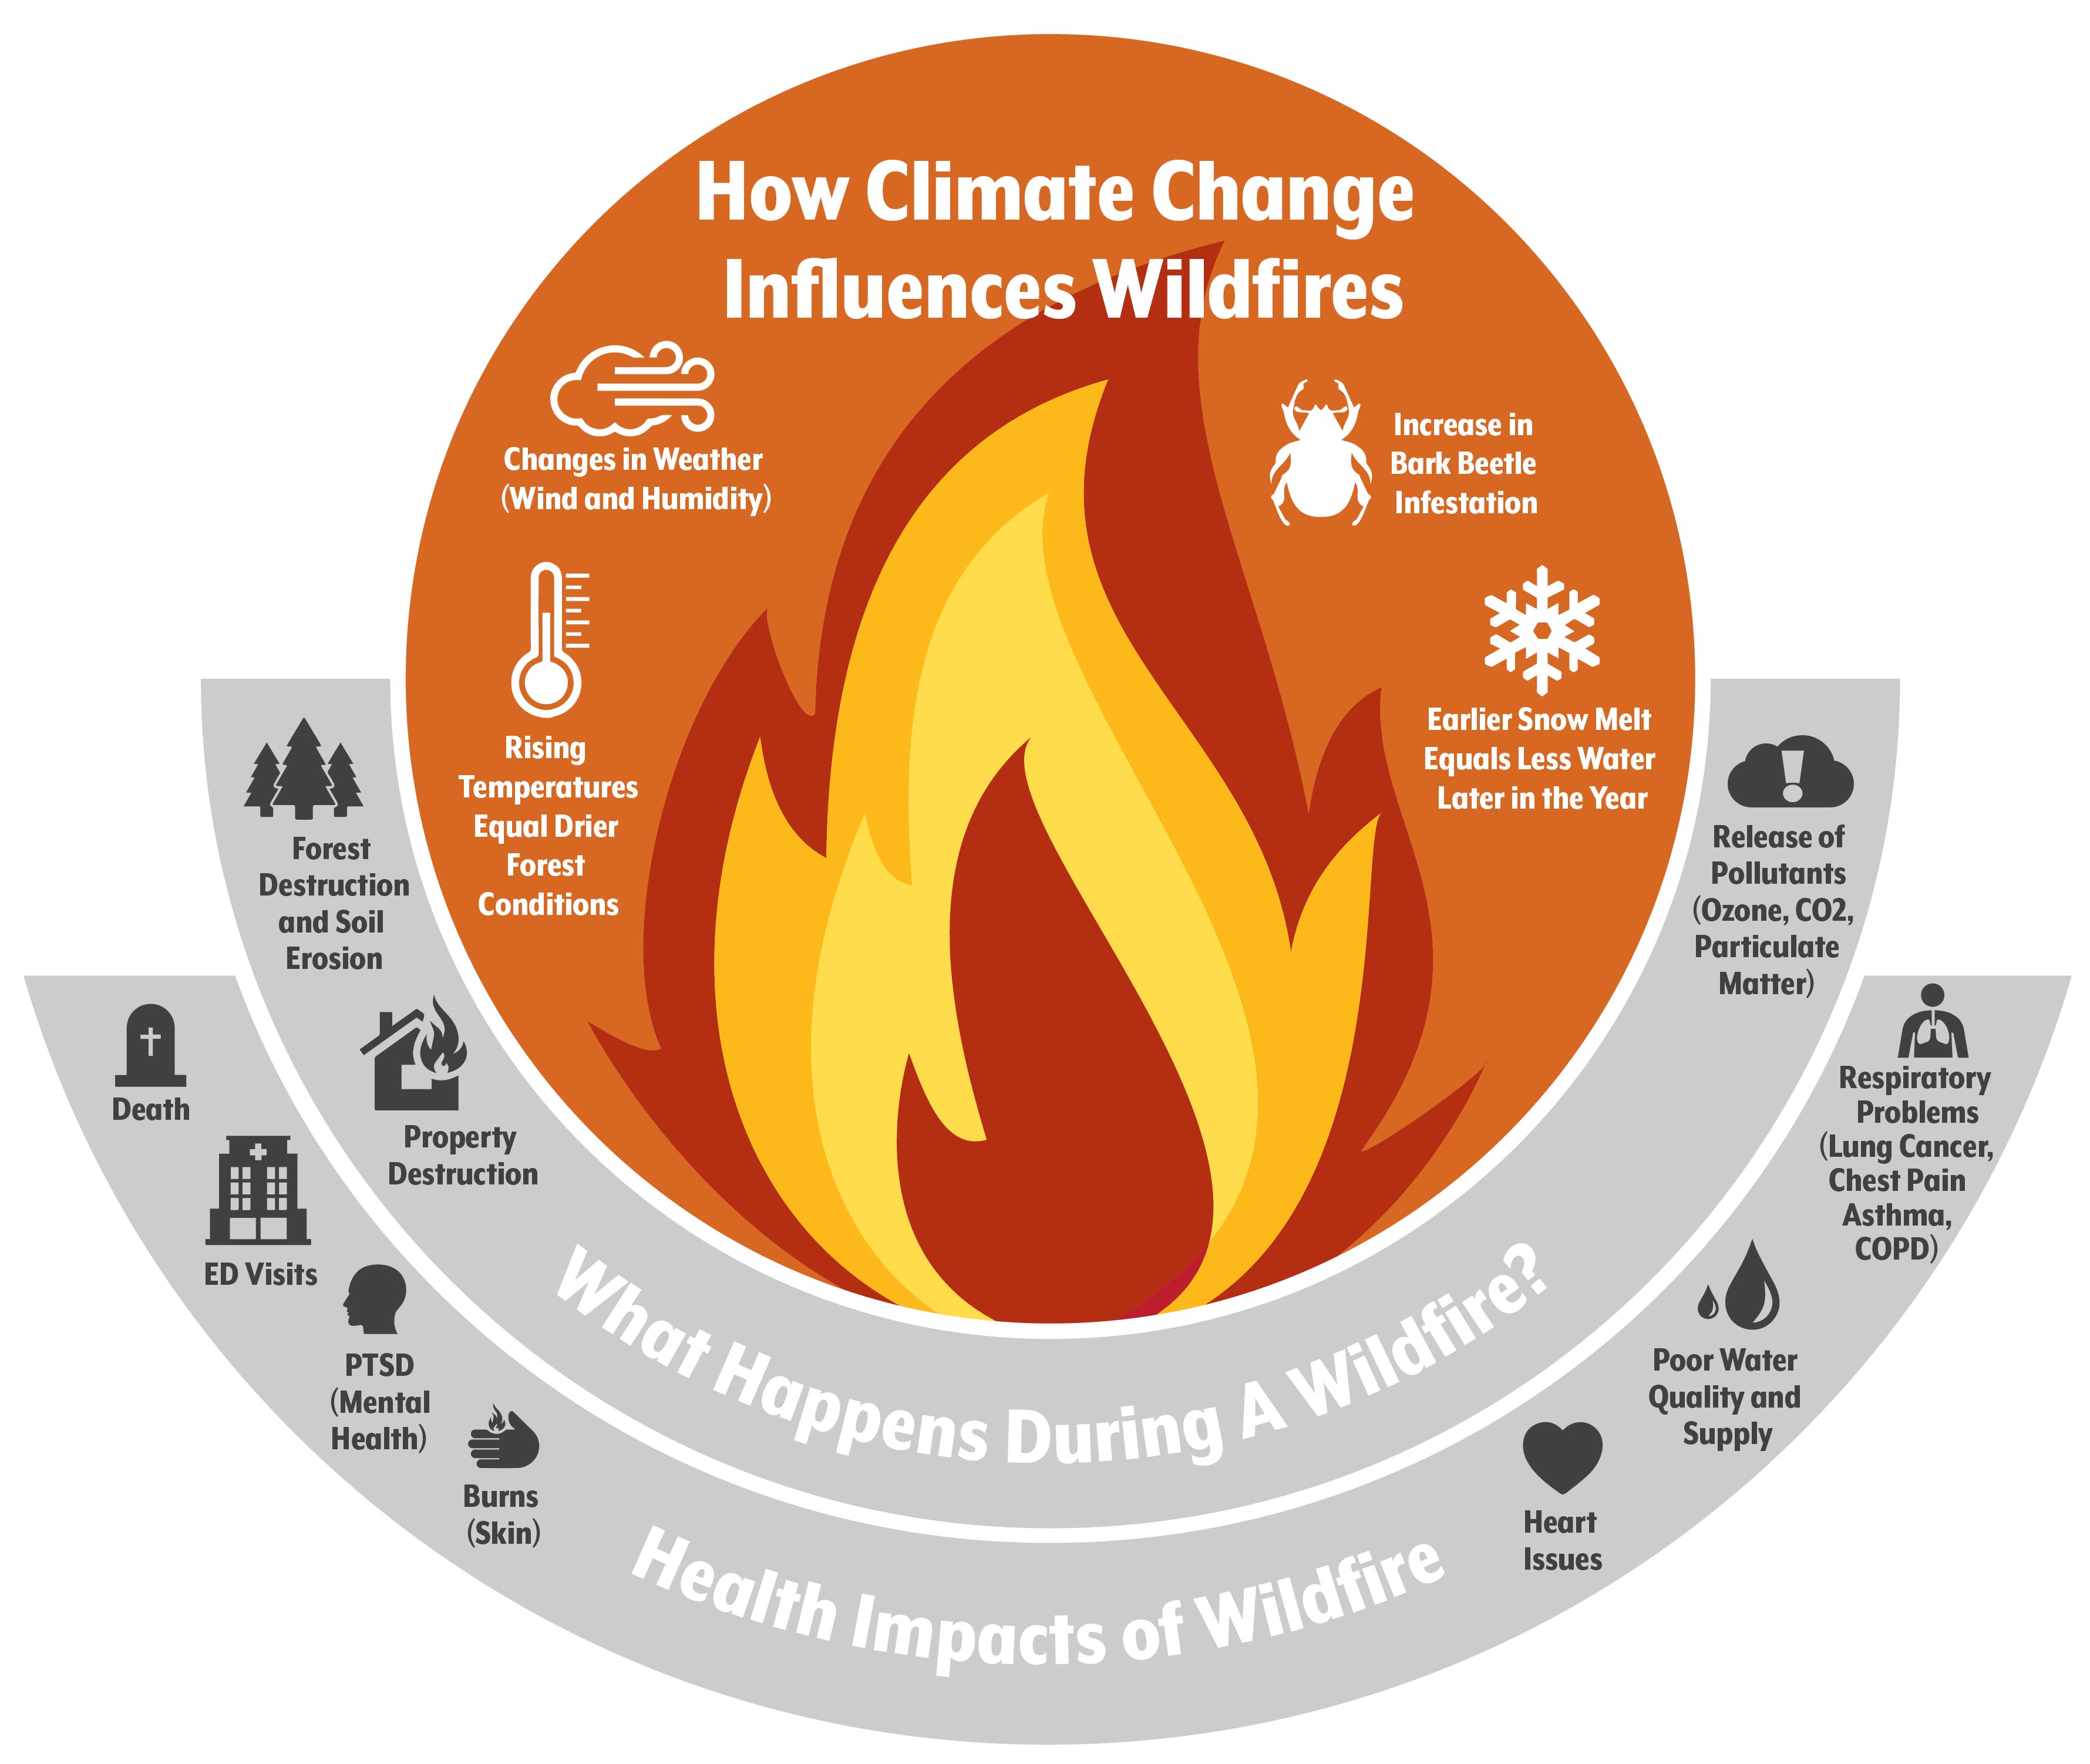
Rising temperatures are shifting the timing of Colorado’s snow melt to earlier in the spring — anywhere from 15 to 30 days sooner over the past 30 years — leaving forests water-starved in the late summer and autumn and creating conditions ripe for fire.48 (See Figure 4.)

Thirsty forests are a welcome environment for the invasive bark beetle, which has destroyed 3.4 million acres in Colorado since 1996.49 Those dead trees, in turn, are volatile fuel for wildfires.

Colorado has seen changes in wildfire trends.50 There were 78 large wildfires (>1,000 acres burned) between 1970 and 2012. But 19 of those wildfires – nearly 25 percent – occurred during the drought years between 2010 and 2012.51 

Smoke from wildfires increases ozone and particulate matter in the air. Pollutants can travel, affecting communities far from the flames. Smoke from the Pacific Northwest fires in August 2015 travelled up to 600 miles.52 The smoke was so dense in some distant states that residents felt certain that the fires were nearby.53   

Wildfires cause soil erosion, which threatens the quality and quantity of the water supply. Hot fire can result in a waxy, water-repellent layer on the soil.54 This leads to water runoff, which can destroy watersheds and contaminate water supplies hundreds of miles from burn sites. After Colorado’s Hayman Fire in 2002, water sources in the surrounding areas had elevated levels of nitrates and particles, causing cloudiness for five years after the blaze.55 

Health Implications

  • Immediate harm takes the form of death, burns, smoke inhalation, traumatic injury and the potential for post-traumatic stress for residents living in fire-prone areas and firefighters.56  
  • Secondary impacts such as induced asthma attacks, coughing, chest pain, eye and nose irritation may be felt by residents living farther away because of smoke’s ability to travel long distances.  
  • Smoke carries pollutants such as particulate matter (PM2.5) in the air, increasing the risk of lung cancer, cardiovascular disease, asthma and COPD.57 

Vulnerable Coloradans

  • Coloradans who live in the wildland-urban interface areas. This population has increased from about 980,000 in 2000 to more than 2 million in 2012.58  
  • Coloradans with COPD, asthma, and lung cancer.59
  • People with cardiovascular disease.

Figure 4. Wildfires

Image

At the Intersection of Climate Change and Health: What’s Being Done

Many climate change policies, research and programs originate at the federal level.   

The United States Department of Agriculture, the Department of Health and Human Services and the Department of Energy are among the federal organizations that develop or enforce climate change-related policies, studies and programs.   

The EPA is the primary organization that creates and implements most of the nation’s climate-related policies, including the Clean Power Plan, the National Environmental Policy Act, the Clean Water Act and the Clean Air Act. 

The overarching goal is to protect the environment by limiting pollutants and emissions, setting standards and requiring environmental assessments and impact statements before building new infrastructure. 

The Clean Power Plan (CPP), finalized in 2015, aims to reduce carbon pollution from power plants. But its fate is uncertain. West Virginia, 27 other states — including Colorado — and hundreds of organizations sued the EPA, claiming the requirements of the CPP are unconstitutional. President Trump in March signed an executive order calling for EPA Director Scott Pruitt to begin dismantling the regulations.

Colorado, meanwhile, is creating climate change policies, ordering studies of the effects of a changing climate and developing evidence-based recommendations and guidelines. 

Colorado voters approved the Renewable Energy Standard in 2004 requiring investor-owned electricity providers — such as Xcel Energy — to obtain 30 percent of their energy from renewable resources by 2020. 

The state legislature updated the standard in 2013 to require cooperative utilities, such as Grand Valley Rural Power Lines, to obtain 20 percent of their electricity from renewable resources by 2020.60, 61     

Renewable resources may be solar, the result of anaerobic digestion, recycled energy, landfill gas, wind, hydropower, geothermal, pyrolysis, coal mine methane or woody biomass.

Colorado has been a leader in clean energy, in large part because of the standard. The state avoided 5.5 million tons of CO2  (carbon dioxide) emissions from utilities in 2012.62  

Former Gov. Ritter released Colorado’s first climate action plan in 2007. The plan called for a 20 percent reduction in greenhouse gas emissions by 2020  and an 80 percent reduction by 2050.63 

Ritter’s plan called on state agencies, private utility companies, businesses and individuals to engage in initiatives such as recommending efficient energy use in households, setting recycling goals, changing farming practices and increasing clean transportation. 

At the local level, Denver became one of the first large American cities to develop its own climate action plan in 2007, setting a goal of reducing greenhouse gas emissions by 10 percent per capita below 1990 levels. Since then, the city has released three updated plans, including one in 2015 which calls for reducing emissions by 80 percent by 2050. 

Denver conducts an annual “GHG inventory” to evaluate emissions levels and progress in reduction efforts. The plan calls for Denver’s building and energy sector to change how structures are built and identify energy efficiency strategies. 

Other Colorado cities taking steps to address climate change include Aspen, Fort Collins and Boulder. Each has created a climate action plans similar to Denver’s.

Aspen followed in the footsteps of Burlington, Vermont, and Greensburg, Kansas, to supply 100 percent of its electricity from renewable energy resources.64 Boulder was the nation’s first city to pass a climate action plan tax, which funds initiatives to reduce emissions. Fort Collins created a ClimateWise voluntary program, which provides residents and local businesses with resources to become more sustainable.65 In 2015, the program helped reduce CO2 emissions by 16,444 metric tons. That’s equivalent to 280,000 roundtrips between Fort Collins and Denver International Airport.66 

Conclusion

Higher temperatures, worsening air quality and more wildfires place the health of all Coloradans at risk.

This report highlights the adverse health effects of climate change – from aggravated asthma and allergies to dehydration and heat stroke. Colorado’s 1.2 million children and 711,000 seniors are especially vulnerable, as are people with chronic conditions such as diabetes and cardiovascular disease.

The good news is that Colorado, in many ways, is leading the way when it comes to health and climate change.

Coloradans have set standards for using renewable energy resources. Initiatives to reduce emissions are being implemented at the state and local level. Communities are preparing for extreme weather, adopting emergency response plans. Strategies from the Colorado Climate Change Plan have set the stage for government agencies, researchers, and organizations to collaborate on addressing this threat to human health.

This work to address climate change has an important goal: helping to improve the health of all Coloradans.

About This Report

This paper marks the first research done by the Colorado Health Institute into the impact of climate change on health. It was prompted by the growing body of scientific research connecting the two. The Colorado Health Institute is an independent, nonpartisan health policy research institute with a mission to provide evidence-based insight and analysis to support sound health policy decision-making.

Recent CHI reports about the impacts of climate change on health include Think Globally, Adapt Locally: Colorado Counties Health and Climate Index (2022) and Colorado's Health and Climate Policy Agenda: A Call to Action to Protect Our Communities from Climate Change (2023).

Enforcing EPA Standards

State and local governments may work under the guidance of or directly with the EPA to implement policies. State Implementation Plans (SIPs), required by the Clean Air Act, are an example of how states comply with federal guidelines. States identify in their SIPs how they will attain or maintain the National Ambient Air Quality Standards which are revised by the EPA every five years.

Currently, the EPA is facing a 31 percent budget cut under President Trump’s budget proposal. This will make it hard to regulate environmental offenders and provide technical assistance to states.

Colorado's Climate Change Plan

The Colorado legislature passed House Bill 13-1293 in 2013, calling for the executive branch to provide periodic updates on the climate change plan.  Governor John Hickenlooper released Colorado’s most recent climate plan in 2015, focusing on seven sectors — water, public health, agriculture, energy, transportation, tourism and recreation — and making recommendations to mitigate and adapt to climate change. 

The recommendations range from implementing the federal Clean Power Plan to training local governments on environmental hazards. The plan identified mitigation initiatives such as reducing the emission of harmful pollutants such as particulate matter, ozone, and nitrogen dioxide. 

Adaption strategies include creating early warning systems and emergency response plans to notify communities about wildfire danger, flooding, and impending extreme weather. The state plan also called for preventive maintenance such as updating infrastructure like dams and reservoirs.

The plan was a collaborative effort by the Colorado Energy Office, the Colorado Department of Public Health and Environment, the Colorado Water Conservation Board, other agencies and private organizations. Researchers from local universities provided evidence that helped shape the policy recommendations.

The Western Water Assessment group, for example, collaborated with Colorado State University and the University of Colorado Boulder to create the Colorado Climate Change Vulnerability Study — a report that summarized potential challenges for each of the seven sectors identified in the 2015 plan. 

The study provides each sector with recommendations for adaptation strategies, including creating water-specific climate change vulnerability assessments for surface and groundwater supplies and a statewide plan for the energy sector that outlines the cascading impacts of drought on energy use.

Endnotes

Expand

1 National Aeronautics and Space Administration (NASA). (February 2005). “What’s the Difference Between Weather and Climate?” https://www.nasa.gov/mission_pages/noaa-n/climate/climate_weather.html

2 The Interagency Working Group on Climate Change and Health. (April 2010) “A Human Health Perspective on Climate Change.” Pg. 2. Environmental health Perspectives and the national Institute of Environmental Health Sciences. Available at: http://www.niehs.nih.gov/health/materials/a_human_health_perspective_on_climate_change_full_report_508.pdf

3 Excessive Heat Event Guidebook. (October 2016) Pg. 3. Environmental Protection Agency. Available at: https://www.epa.gov/sites/production/files/2016-10/documents/extreme-heat-guidebook.pdf

4 Delwiche, Jake. (2010). “After the Fire, Follow the Nitrogen.” University of Nebraska — Lincoln. Avilable at: http://digitalcommons.unl.edu/cgi/viewcontent.cgi?article=1079&context=jfspbriefs

5 Toxic Substances Portal for Nitrate and Nitrite. (September 2015). Agency for Toxic Substances and Disease Registry. https://www.atsdr.cdc.gov/toxfaqs/tf.asp?id=1186&tid=258

6 Colorado Climate Plan. (2015). “Chapter 3.3.1: Ozone and 3.3.2: Particulate Matter.” Pg. 20. https://www.codot.gov/programs/environmental/Sustainability/colorado-climate-plan-2015

7 The World Health Organization. Ambient (outdoor) Air Quality and Health (September 2016). Available at http://www.who.int/mediacentre/factsheets/fs313/en/

8 The USGS Water Science School. (2016). “Turbidity.” https://water.usgs.gov/edu/turbidity.html

9 NASA. (February 2015). “What’s the Difference Between Weather and Climate?”

10 The Impacts of Climate Change on Human Health in The United States. (2016). “Chapter 1 Introduction: Climate Change and Human Health.” https://s3.amazonaws.com/climatehealth2016/low/ClimateHealth2016_01_Introduction_small.pdf

11 Lukas, Jeff, et. al. (August 2014). “Climate Change in Colorado.” Pg. 2. Available at: http://cwcbweblink.state.co.us/WebLink/ElectronicFile.aspx?docid=191995&searchid=e3c463e8-569c-4359-8ddd-ed50e755d3b7&dbid=0

12 Lukas, J. et. al. (August 2014) pg. 2

13 Tebaldi, C. et. al. (June 2012). “The Heat is On, Climate Central.” Pg. 5. Climate Central. Available at: http://www.climatecentral.org/wgts/heat-is-on/HeatIsOnReport.pdf

14 Hayhoe, K. et. al. (2013). Graphic: “1700 Years of Temperature Change from Proxy Data.” National Climate Assessment. Available at: https://data.globalchange.gov/report/nca3/chapter/appendix-climate-science-supplement/figure/1700-years-of-global-temperature-from-proxy-data

15 American Public Health Association. (2017). “Climate Change.”
https://www.apha.org/topics-and-issues/climate-change

16 Global Environmental Outlook. (2016). “Regional Assessment for North America.” United Nations Environment Program Pg. 132. Available at: http://www.unep.org/geo/sites/unep.org.geo/files/documents/geo_assesment_north_america_november_2016.pdf

17 University of Colorado Boulder. Environmental Center. Impacts in Colorado. Available at: http://www.colorado.edu/ecenter/energyclimate-justice/general-energy-climate-info/climate-change/impacts-colorado

18 Colorado Climate Center. Drought Resources. Available at:
http://climate.colostate.edu

19 Centers for Disease Control and Prevention. “Climate Change and Extreme Heat Events.” Available at: https://www.cdc.gov/climateandhealth/pubs/ClimateChangeandExtremeHeatEvents.pdf

20 Coupled Modeling Intercomparison Project Phase 5 (CMIP5) Projections. Available at: http://cmip-pcmdi.llnl.gov/cmip5/

21 Lukas, J. et. al. (August 2014)

22 National Weather Service. “Summer Temperatures for Denver.” National Oceanic and Atmospheric Administration. Available at: http://www.weather.gov/Bou/DenverSummerTemperatureStatistics

23 Centers for Disease Control and Prevention. “Climate Change and Extreme Heat Events.”

24 NOAA’s Western Water Assessment Team. (2016). “Climate Change and Projections.” http://wwa.colorado.edu/climate/change.html

25 National Oceanic and Atmospheric Administration. (August 2014). “Future Temperature and Precipitation Change.” https://www.climate.gov/news-features/featured-images/future-temperatur…

26 U.S. Climate Data. (2017). “Climate Pueblo – Colorado.” Available at: http://www.usclimatedata.com/climate/pueblo/colorado/united-states/usco0323

27 United States Environmental Protection Agency. (August 2016). “What Climate Change Means for Colorado.” Available at:
https://www.epa.gov/climatechange/Downloads/impacts-adaptation/climate-change-CO.pdf

27 United States Environmental Protection Agency. (August 2016). “What Climate Change Means for Colorado.” Available at https://nepis.epa.gov/Exe/ZyPURL.cgi?Dockey=P100QV8O.txt

28 Centers for Disease Control and Prevention. (June 2016) “Managing Diabetes in the Heat.” https://www.cdc.gov/features/diabetesheattravel/

29 Public Health Institute: Center for Climate Change and Health. (2016) “Extreme Heat, Climate Change and Health.” http://climatehealthconnect.org/wp-content/uploads/2016/09/ExtremeHeat.pdf

30 AirNow. (September 2014). “Good Up High Bad Nearby – What is Ozone?” https://cfpub.epa.gov/airnow/index.cfm?action=gooduphigh.index

31 Ozone Aware. “Here’s the Dirt on Ground-Level Ozone.” http://ozoneaware.org

32 American Lung Association. (2016). “Most Polluted Cities.” http://www.lung.org/assets/documents/healthy-air/state-of-the-air/sota-2016-full.pdf

33 American Lung Association. (2017). “Most Polluted Cities.” Available at: http://www.lung.org/our-initiatives/healthy-air/sota/city-rankings/most-polluted-cities.html?referrer=http://www.lung.org/our-initiatives/healthy-air/sota/city-rankings/states/understanding-the-grades-and-tables.html

34 American Lung Association. “Healthy Air: Ozone.” http://www.lung.org/our-initiatives/healthy-air/outdoor/air-pollution/ozone.html#wheredoes

35 American Lung Association. (2017). “State of the Air 2017” – Fort
Collins, CO. http://www.lung.org/our-initiatives/healthy-air/sota/city-rankings/msas/fort-collins-co.html#ozone

36 American Lung Association. (2017). “State of the Air: 2017 – Denver-Aurora, CO.” http://www.lung.org/our-initiatives/healthy-air/sota/city-rankings/msas/denver-aurora-co.html#ozone

37 Colorado Department of Public Health and Environment. (2017). “Ozone information.” Available at: https://www.colorado.gov

38 Colorado Department of Public Health and Environment. (November 2016). “Ozone State Implementation Plan.” Available at: https://raqc.egnyte.com/dl/q5zyuX9QC1/FinalModerateOzoneSIP_2016-11-29.pdf_

39 EPA, Ozone NAAQS Timelines (2017). Available at: https://www.epa.gov/ozone-pollution/ozone-naaqs-timelines

40 Colorado Department of Public Health and Environment: “EPA lowers federal ozone standard; Colorado, other states face more difficult compliance.” (2015). Available at: https://www.colorado.gov/cdphe/news/ozone

41 The Denver Post. “Colorado, failing to meet smog standard, faces tougher limit” (2015). Available at: http://www.denverpost.com/2015/10/01/colorado-failing-to-meet-smog-standard-faces-tougher-limit/

42 EPA, Ozone NAAQS Timelines (2017). Available at: https://www.epa.gov/ozone-pollution/ozone-naaqs-timelines

43 The Impacts of Climate Change on Human Health in The United States. Chapter 3: Air Quality Impacts. (2016). Pg. 72. Available at: https://s3.amazonaws.com/climatehealth2016/low/ClimateHealth2016_03_Air_Quality_small.pdf

44 American Lung Association. “Report Card: Colorado, Groups at Risk” (2017). Available at http://www.lung.org/our-initiatives/healthy-air/sota/city-rankings/stat…

45 Colorado Climate Vulnerability Study: A report submitted to the Colorado Energy Office (2015). Chapter 10: Public Health Sector, Pg. 151. Available at: http://wwa.colorado.edu/climate/co2015vulnerability/co_vulnerability_report_2015_final.pdf

46 Climate Change in Colorado: A Synthesis to Support Water Resources Management and Adaptation (2014). Chapter 2: “The Observed Record,” Pg. 34. Available at: http://cwcbweblink.state.co.us/WebLink/ElectronicFile.aspx?docid=191995&searchid=e3c463e8-569c-4359-8ddd-ed50e755d3b7&&dbid=0

47 Climate Change in Colorado: A Synthesis to Support Water Resources Management and Adaptation (2014). “Executive Summary:” Pg.4. Available at: http://wwa.colorado.edu/climate/co2014report/Climate_Change_CO_Report_2014_FINAL.pdf

48 Report on The Health of Colorado’s Forests: Fire and Water (2016). Pg 15. https://csfs.colostate.edu/media/sites/22/2017/02/CSU_304464_ForestReport-2016-www.pdf

49 Climate Change in Colorado: A Synthesis to Support Water Resources Management and Adaptation (2014). Chapter 2: “Observed Record,” Pg. 35. Available at: http://cwcbweblink.state.co.us/WebLink/ElectronicFile.aspx?docid=191995&searchid=e3c463e8-569c-4359-8ddd-ed50e755d3b7&&dbid=0

50 The Denver Post. “Colorado wildfires, major fires from 1971-2013:” Interactive graphic. Available at: http://www.denverpost.com/2014/06/07/colorado-wildfires-major-fires-from-1971-2013-interactive-graphic/

51 Public Health Institute/Center for Climate Change and Health. Chapter 7.3: “Wildfires, Climate Change, and Health” (2016). Available at: http://climatehealthconnect.org/wp-content/uploads/2016/09/Wildfires.pdf

52 Wildfire Today. “Smoke from fire in Washington creating concern in Montana” (2015). Available at: http://wildfiretoday.com/2015/08/02/smoke-from-fire-in-washington-creat…

53 Colorado State University Extension. “Soil Erosion After Wildfire.” Available at: http://extension.colostate.edu/soil-erosion-control-after-wildfire-6-308/

54 Colorado Water Plan. Chapter 4: “Water Supply, Section Variability in Water Supplies,” Pg. 5. Available at: http://cwcbweblink.state.co.us/WebLink/ElectronicFile.aspx?docid=199502&searchid=80d50cb3-95bf-405c-bfa5-587c633c7136&dbid=0

55 Public Health Institute/Center for Climate Change and Health. Chapter 7.3: “Wildfires, Climate Change, and Health” (2016). Available at: http://climatehealthconnect.org/wp-content/uploads/2016/09/Wildfires.pdf

56 Public Health Institute/Center for Climate Change and Health. Chapter 7.3: “Wildfires, Climate Change, and Health” (2016). Available at: http://climatehealthconnect.org/wp-content/uploads/2016/09/Wildfires.pdf

57 Report on the Health of Colorado’s Forests. “Fire and Water.”(2016). Pg. 4. Available at: https://csfs.colostate.edu/media/sites/22/2017/02/CSU_304464_ForestReport-2016-www.pdf

58 American Lung Association. “People at Risk” (2017). Available at: http://www.lung.org/our-initiatives/healthy-air/sota/key-findings/people-at-risk.html#peopleasthma

59 Colorado Energy Office. “Renewable Energy Standard” (2017). Available at: https://www.colorado.gov/pacific/energyoffice/renewable-energy-standard

60 Colorado Rural Electric Association. “List of Electric Co-ops.” Available at: http://crea.coop/electric-co-ops-2/

61 Colorado Climate Change Plan (2015). Chapter 1, Section 2. Pg.3. Available at: http://cwcbweblink.state.co.us/WebLink/ElectronicFile.aspx?docid=196541&searchid=243b8969-739b-448c-bd2d-699af9b7aea0&dbid=0

62 Colorado Climate Action Plan (2007). “Executive Summary: Reduce Greenhouse Gas Emissions.” Pg 3. Available at: http://sciencepolicy.colorado.edu/students/envs_4100/ritter_2007.pdf

63 Mayors National Climate Action Agenda, Cities Climate Action Compendium (2017). Available at: http://www.climate-mayors.org/cities-climate-action-compendium/#block-yui_3_17_2_8_1464797356698_46219

64 City of Fort Collins, ClimateWise (2017). Available at:
https://www.fcgov.com/climatewise/about.php

65 City of Fort Collins, ClimateWise. “2015 Operations Report.” Available at: https://www.fcgov.com/climatewise/pdf/2015_cw_operationsreport.pdf

66 Colorado State Legislature (2013) House Bill 13-1293. Available at: http://www.leg.state.co.us/clics/clics2013a/csl.nsf/fsbillcont/FD5B92C7D67F90F787257AEE0058A740?Open&file=1293_enr.pdf